
Los Angeles Wildfire and Smoke Risk Maps by The New York Times
Illustrating the Wildfire and Smoke Hazard Levels in Los Angeles
The New York Times has created a set of maps that show wildfire and smoke risk throughout Los Angeles County, which has been dealing with devastating wildfires since early January. These maps utilize wildfire risk scores from CoreLogic and spatial data from SILVIS Lab at the University of Wisconsin-Madison to reveal the threat level in various neighborhoods. Areas with lower risk are depicted in green hues, while neighborhoods with higher risk are shown in red and purple tones. Interestingly, even locations not closely connected to the Palisades fire possess extreme risk levels, particularly in hill and coastal regions.
Here's a closer look:
It's intriguing to ponder how The New York Times employs CoreLogic and SILVIS Lab data to construct their wildfire and smoke risk map. While specifics may not be easily found, it's worth understanding how such maps are typically assembled.
The Blueprint of Wildfire Risk Mapping
Wildfire risk maps usually combine various data sources to foresee the probabilities and potential impacts of wildfires in different regions. Examples of these sources include:
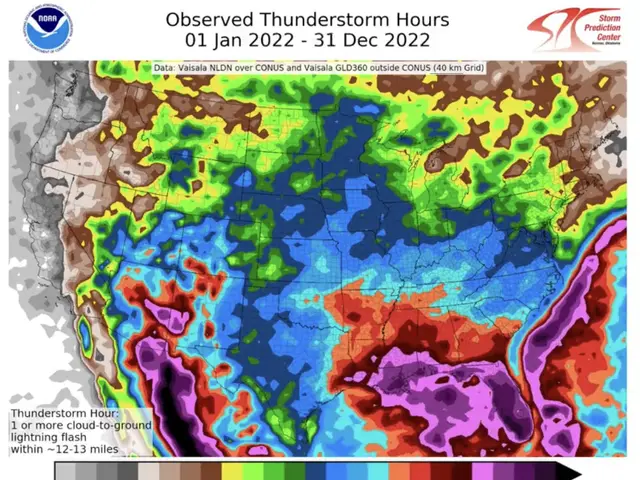
- Satellite Imagery: Tools like NOAA's Hazard Mapping System offer real-time data on fires and smoke, aiding in the identification of regions with high risk.
- Geospatial Data: Companies like CoreLogic often provide property-level data, helping to pinpoint the vulnerabilities of specific neighborhoods.
- Climate and Environmental Data: Organizations such as SILVIS Lab may analyze factors like vegetation health, soil moisture, and weather patterns, which are essential for forecasting wildfire risk.
The Role of CoreLogic and SILVIS Lab Data
- CoreLogic Data: CoreLogic could offer detailed property-level data, including information regarding land use, building types, and proximity to wildfire-prone areas. This information could help identify neighborhoods housing properties with high wildfire risk.
- Financial Impact Analysis: CoreLogic's data might also be used to estimate the potential financial consequences of wildfires on neighborhoods, helping in prioritizing mitigation efforts.
- SILVIS Lab Data: SILVIS Lab may provide information on local vegetation, soil conditions, and other environmental factors that affect wildfire risk. Their data might also include analysis of climate and weather conditions, such as drought and wind patterns, which are essential for anticipating wildfire behavior.
Assembling a Risk Map
For the Los Angeles County wildfire risk map, these data sources would most likely be assembled in the following manner:
- Layering Data: Integrating different types of data (environmental conditions from SILVIS Lab and property-level risk data from CoreLogic) would provide a thorough perspective on risk areas.
- Risk Scoring: Each neighborhood or area would be given a risk score based on the combination of these data points, helping users identify high-risk regions swiftly.
- Visual Representation: The map would visually depict these risk scores using color coding or shading to differentiate between areas of high, moderate, and low risk.
The utilization of CoreLogic and SILVIS Lab data in creating wildfire risk maps, such as the ones shown by The New York Times for Los Angeles County, highlights the importance of data sciences like environmental science and weather forecasting. In these maps, climate and environmental data from SILVIS Lab are combined with property-level data from CoreLogic to forecast the probabilities and potential impacts of wildfires. This compiled information is then visualized to help users identify high-risk regions and aid in prioritizing mitigation efforts, offering valuable insights for communities facing climate-change-related issues like wildfires.